📙
QuickAdminPanel
  • QuickAdminPanel Docs
  • Quick Start: Creating Panel
    • Creating a Simple CRUD
    • Radio/Checkbox/Select Fields
    • Relationships fields: belongsTo/belongsToMany
    • File/Photo Upload Fields
    • Date/Time Picker Fields
    • Multi-language Projects
    • API Generator
    • Roles and Permissions
    • How to Change Design Template/Theme
  • Using the Generated Code
    • Download Code and Install on Your Web-Server
    • Push Code to Your Github
    • Edit Code and Merge Changes
    • What Files are Inside the CRUD
  • Modules
    • Modules Overview
    • AJAX Datatables
    • System Calendar
    • Audit Changes Logs
    • Dashboard and Reports
    • Multi-Tenancy
    • CSV Import
    • Global Search
    • User Registration
    • Internal Messages
    • Change Notifications
    • Tasks + Calendar
    • Courses LMS
    • CRUD Templates Modules
  • Customizing the Code
    • Datatables Customizations
    • Upgrade Laravel version
    • Dependent Dropdowns: Parent-Child
    • Add Front User Without Admin Permissions
    • How to Add Mass Actions to Datatable
  • Vue.js + Laravel API Version
    • QuickAdminPanel: Vue.js+Laravel Version
    • What Files are Inside Vue.js+Laravel CRUD?
    • Installing Downloaded Vue.js+Laravel Panel
  • Livewire + Tailwind Version
    • QuickAdminPanel: Livewire+Tailwind Version
    • What Files are Inside Livewire+Tailwind CRUD?
    • Installing Downloaded Livewire+Tailwind Panel
Powered by GitBook
On this page
  1. Modules

Dashboard and Reports

PreviousAudit Changes LogsNextMulti-Tenancy

Last updated 4 years ago

This module allows you to add multiple Report Widgets to your Dashboard. There are five types of Widgets, each with its own parameters.
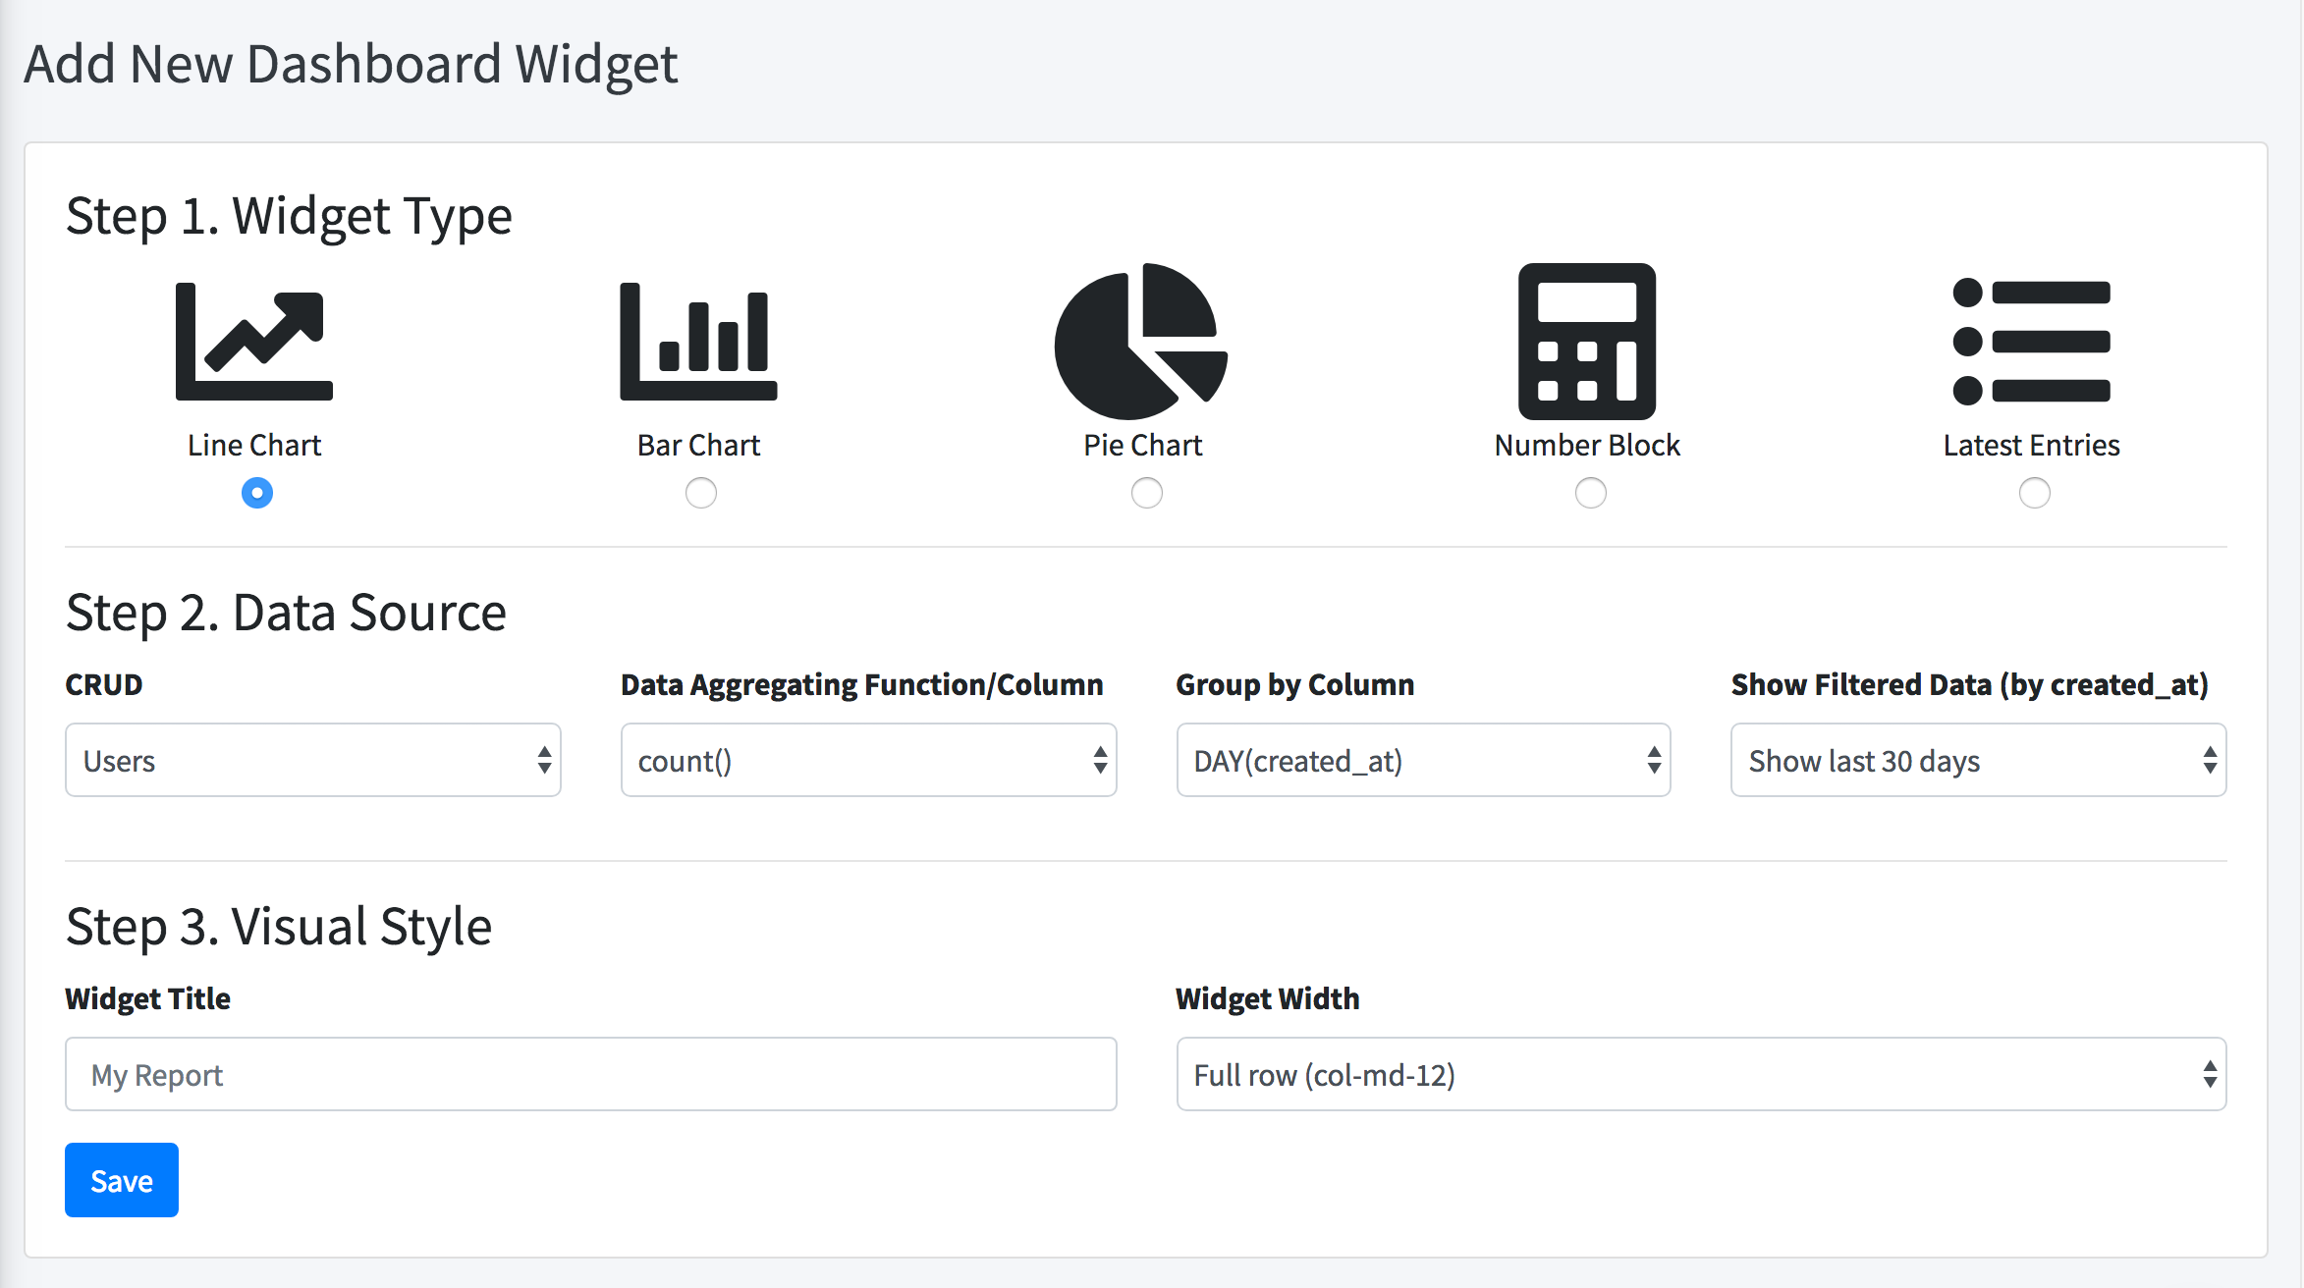
You can create as many widgets as you want, specifying width for each of them, this way constructing your whole dashboard.

Video demo of the module:

In downloaded code, we generate HomeController.php which may look like this:

use LaravelDaily\LaravelCharts\Classes\LaravelChart;

class HomeController
{
    public function index()
    {
        $settings1 = [
            'chart_title'        => 'Users By Day',
            'chart_type'         => 'line',
            'report_type'        => 'group_by_date',
            'model'              => 'App\User',
            'group_by_field'     => 'created_at',
            'group_by_period'    => 'day',
            'aggregate_function' => 'count',
            'filter_field'       => 'created_at',
            'filter_days'        => '30',
            'column_class'       => 'col-md-12',
            'entries_number'     => '5',
        ];

        $chart1 = new LaravelChart($settings1);

        $settings2 = [
            'chart_title'        => 'Latest Users',
            'chart_type'         => 'latest_entries',
            'report_type'        => 'group_by_date',
            'model'              => 'App\User',
            'group_by_field'     => 'email_verified_at',
            'group_by_period'    => 'day',
            'aggregate_function' => 'count',
            'filter_field'       => 'created_at',
            'column_class'       => 'col-md-12',
            'entries_number'     => '5',
            'fields'             => [
                '0' => 'name',
                '1' => 'email',
                '2' => 'created_at',
            ],
        ];

        $settings2['data'] = $settings2['model']::latest()
            ->take($settings2['entries_number'])
            ->get();

        return view('home', compact('chart1', 'settings2'));
    }
}

You can also group entries by relationships, see video:

For viewing charts, we use our own simple package called .

Laravel Charts